
Code coverage measures how much of the code is covered when running tests. This is a useful indicator of how effective tests are. One of the features we want to add is to set a minimum bar for testing to increase the quality of our components.
Visual Studio 2022 Community Edition doesn’t automatically include code coverage features out of the box. There are some things we can do to expose it in Jenkins during our build processes, validate the results, and possibly fail the build based on it. Within Visual Studio itself, you can install Fine Code Coverage from the Visual Studio Marketplace or consider tools such as NCrunch.
Adding additional steps to Jenkins won’t take long to get code coverage data and expose it on the Jenkins build page.
Jenkins Plugins
Some Jenkins Plugins are required to get the features we need.
- Go to Manage Jenkins ⇾ Manage Plugins ⇾ ‘Available’ tab.
- Add: Code Coverage API
- Add: Cobertura
- Add: Git Forensics
Groovy Script Changes
The changes to the Jenksinfile.groovy are minimal. We need to update how we run tests with the –collect option to generate the code coverage information:
       stage ("Run Tests") {
            steps {
                // MSTest projects automatically include coverlet that can generate cobertura formatted coverage information.
                bat """
                    dotnet test --nologo -c Release --results-directory TestResults --logger trx --collect:"XPlat code coverage" --no-restore --no-build
                    """
            }
        }
“XPlat code coverage” activates the coverlet package for gathering information and generates the coverage output in the Cobertura xml format by default.
As described above, there is already a code coverage reference in MSTest projects called coverlet that can gather the information emitted to the TestResults folder.
The next step is to process the code coverage information and publish it:
       stage ("Publish Code Coverage") {
            steps {
                publishCoverage(adapters: [
                  coberturaAdapter(path: "TestResults/**/In/**/*.cobertura.xml", thresholds: [
                    [thresholdTarget: 'Group', unhealthyThreshold: 100.0],
                    [thresholdTarget: 'Package', unhealthyThreshold: 100.0],
                    [thresholdTarget: 'File', unhealthyThreshold: 50.0, unstableThreshold: 85.0],
                    [thresholdTarget: 'Class', unhealthyThreshold: 50.0, unstableThreshold: 85.0],
                    [thresholdTarget: 'Method', unhealthyThreshold: 50.0, unstableThreshold: 85.0],
                    [thresholdTarget: 'Instruction', unhealthyThreshold: 0.0, unstableThreshold: 0.0],
                    [thresholdTarget: 'Line', unhealthyThreshold: 50.0, unstableThreshold: 85.0],
                    [thresholdTarget: 'Conditional', unhealthyThreshold: 0.0, unstableThreshold: 0.0],
                  ])
                ], failNoReports: true, failUnhealthy: true, calculateDiffForChangeRequests: true)
            }
        }
Thresholds indicate when to mark a build unstable (yellow) or unhealthy (failed with the failUnhealthy option). Values are percentages where 0% is untested, and 100% is maximum coverage. Generally unstable will be at a higher percentage than unhealthy. Note that unstable is considered a failure for GitHub status, blocking integrations.
While I did update the sample to have the test project validate some basic code added to the sample project, because they are minimal, it results in some odd number results in measuring.
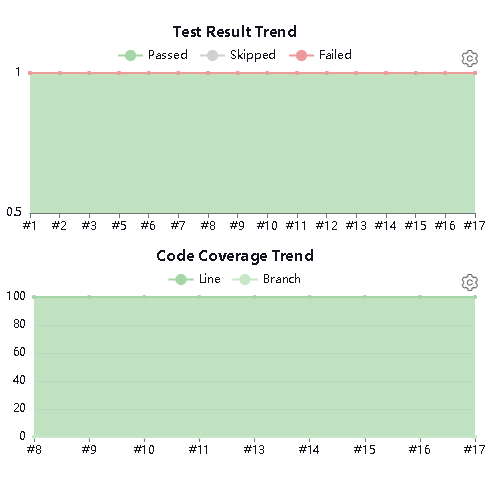
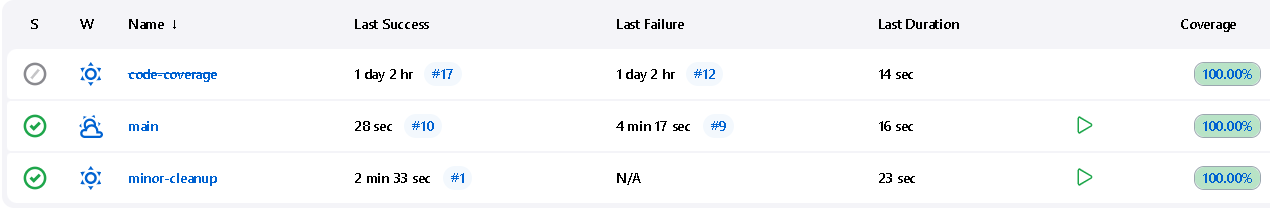
We can see code coverage now reported in Jenkins, and after a few commits, it will also show changes over time:
hi, thanks for post, small question will such setup provide ability to view code coverage in line level granularity?
Hi! I’m so sorry it took so long to get back to you, I’ve been preoccupied with life 😀
If the code coverage is run in debug as I set it up, it will give you the specific lines tested much more accurately. Running in release/optimized may miss lines as being traversed.